
Section 4.2 Scale Drawing

Scale drawing is a way of representing real objects or spaces on paper using a fixed ratioβ€”so that large things (like buildings or roads) can be drawn small, but still accurately.
It opens the door to connecting mathematics with the real world in meaningful, visual ways.

Subsection 4.2.1 Identifying Compass and True Bearings in Real Life Situations

Subsubsection 4.2.1.1 Compass Bearing

Activity 4.2.1.
Work in groups
You are required to identify directions using compass points (e.g North, East, e.t.c) and relate them to real landmarks around the school.
Materials needed
A simple handheld compass, clipboards or drawing paper, pencils or pens, a basic sketch map of the school grounds (or blank paper to create one).
  • Set a Reference Point: Choose a central feature like the school flagpole or assembly ground. This will be the reference for all directional observations.
  • Mark Cardinal Points: Students stand at the reference point. Use the compass to find and mark True North Identify and sketch the \(8\) main compass directions (N, NE, E, SE, etc.)
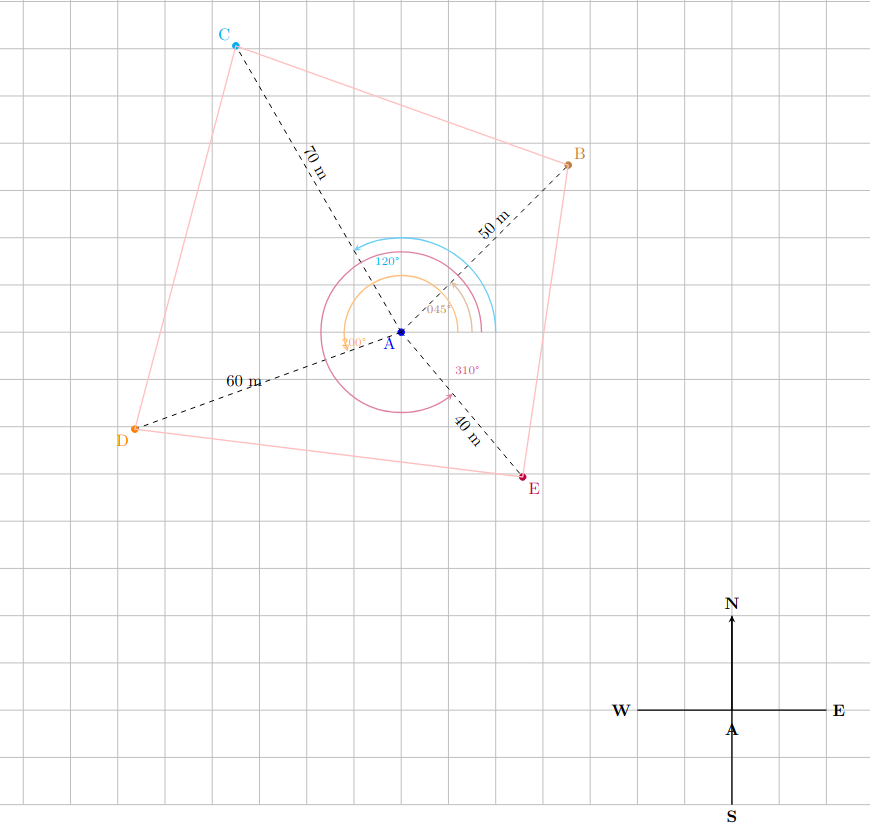
  • Observe and Record Compass Bearings: From the reference point, each group chooses 3 visible features (e.g. gate, staffroom, classroom door). For each feature, describe the direction using compass points (e.g. "The gate is SE of the flagpole").
  • Map It Out: Sketch a simple compass rose and map out the features in their corresponding directions.
  • Discuss your findings with other learners. How could compass directions help you give directions without using distances?
\(\textbf{ Key Takeaway }\)
Compass bearing gives the direction using the cardinal points and the secodary points of a compass.
The cardinal points are the main points (North(N), East(E), West(W) and South(S)) while the secondary points are: North East(NE), South East(SE), South West(SW) and North West(NW).
The compass bearing is always given as \(N\theta^\circ E, \, S\theta^\circ W\) e.t.c where \(\theta^\circ\) is an acute angle from one cardinal point to the other.

Subsubsection 4.2.1.2 True Bearing

Activity 4.2.2.
Work in groups
You are required to measure the true bearing of objects from a reference point in degrees (from 0Β° to 360Β°).
Materials needed
Protractors, compass, school map or blank paper and clipboards and pencils.
  • Use the same central location (e.g. flagpole) and using the same 3 landmarks you identified.
  • Using a protractor, measure the true bearing of each landmark, true bearing is measured clockwise from true North. Record each as a three-figure bearing (e.g. 045Β°, 270Β°).
  • On a sketch map, draw arrows from the origin showing each bearing.
\(\textbf{ Key Takeaway }\)
True bearing of one place from another is measured clockwise from true North. It is record as a three-figure bearing (e.g. 005Β°, 045Β°, 270Β°).
Example 4.2.1.
  1. Determine the compass bearing of point P from point Q.
  2. Determine the true bearing of point P from point Q.
Solution.
Draw a compass at the point Q, which is the reference point.
Draw a straigth line connecting the two point and measure the angle formed by the line and the true North of point Q.
  1. P is North East from Q and the and the angle measure is \(45^\circ\text{.}\) The compass bearing of Q from P is \(N45^\circ E\)
  2. The true bearing of point Q from P is \(045^\circ\)

Subsection 4.2.2 Determining the Bearing of One Point From Another in Real Life Situations

Activity 4.2.3.

Work in groups
Materials Needed
Compass, clipboards, pencils, school compound map (or blank paper for sketching).
  • In your groups, choose a starting point within the school compound (e.g., school gate, flagpole, staffroom).
  • Each group will hoose 3–4 other landmarks around the school.
  • Use the compass to determine the bearing from their starting point to each landmark.
  • Record bearings using three-figure notation (e.g., 092Β°).
\(\textbf{ Key Takeaway }\)
Directional information is essential for locating positions accurately in practical contexts like travel, rescue missions, and route planning.

Example 4.2.2.

Find the bearing of:
Solution.
  • To find the bearing of point A from C, first draw a compass at the starting point, which is C in this case. Then connect point A to C using a line. Using a compass, measure the angle ( in the clockwise direction) formed by the North line at C and the line AC. Place your compass at C such that the \(0^\circ\) mark lies on the North line. Therefore, A is on a bearing of \(315^\circ\) from C.
  • Using a similar approach, from the one above, C is on a bearing of \(135^\circ\) from A
  • C is on a bearing of \(090^\circ\) from B.
  • A lies directly North of B (A is due North of B). Therefore, A is on a bearing of \(000^\circ\) from B.

Subsection 4.2.3 Locating a Point Using Bearing and Distance in Real Life Situations

Activity 4.2.4.

Work in groups
Materials Needed
Compass, measuring tape or meter wheel, clipboards, pencils, school compound map (or blank paper for sketching).
  • In your groups, choose a starting point within the school compound (e.g., school gate, flagpole, staffroom).
  • Each group will hoose 3–4 other landmarks around the school.
  • Use the compass to determine the bearing from their starting point to each landmark.
  • Measure or estimate the distance between their point and each landmark. Record bearings using three-figure notation (e.g., 072Β°).
  • Create a scaled sketch map of the landmarks showing relative positions, distances and bearings.
  • Each group presents one of their bearings and explain how they measured it. What challenges did you face in this activity? (e.g., compass interference) What are the real-world implications of bearing (e.g., navigation, mapping, aviation).
\(\textbf{ Key Takeaway }\)
Bearings and distances is used to accurately determine and plot the location of an object or landmark on a map.

Example 4.2.3.

Point P is \(1300\,m\) due west of point Q. Point R is \(400 \, m\) due north of point Q. Point S is \(1000\,m\) due west of R. Using a scale of \(1\,m \text{ rep } 100\,cm,\) sketch the given information and answer the following questions:
Solution.
Sketch the given information:
The sketch when drawn to scale of \(1\,m \text{ rep } 100\,cm:\)
  • Use a compass to find the bearing of point S from Q. The bearing of S from P is \(045^\circ.\)
  • Use a ruler to measure the drawing length PS then convert your answer to the actual disatnce using the given scale. The drawing length of PS is \(5\,cm.\) Therefore the actual distance will be \(5 \, \times 100 \, m = 500 \, m.\)

Subsection 4.2.4 Identifying Angles of Elevation in Real Life Situations

Activity 4.2.5.

Work in groups
  • Identify Observation Points: Select a tall object around the school compound (e.g. flagpole). Mark three different distances from the object (e.g. 5 m, 10 m, 15 m).
  • Observe and Record: At each marked point: Look at the top of the object, record the angle at which you tilt your head upward. Note the horizontal distance from the base of the object.
  • Sketch the Scenario: Draw scaled right-angled triangles showing: The base (horizontal distance), the height of the object (calculate using trigonometry if desired) and the angle when you tilt your head at each position.
  • Discuss with other learners: How does the angle change as the distance increases?
\(\textbf{Key Takeaway}\)
The angle at which you tilt your head upward when looking at the top of an ojject is known as the angle of elevation.
The angle of elevation \((\theta)\) is the angle formed between a horizontal line ( Eye-level) and a line of sight when you look upward at an object. For example, when you gaze up at the top of a tree from the ground, the angle your eyes make above the eye-level is the angle of elevation.

Example 4.2.4.

Hamadi is flying a kite \(40 \, m\) above his eye level. The horizontal distance between Hamadi and the kite is \(30 \, m.\) Using a scale of \(1\, cm = 10\, m,\) represent the above information to scale drawing. Measure the angle of elevation.
Solution.
The sketch will resemble:
The scale drawing of the sketch using the scale of \(1\, cm = 10\, m:\)
The angle of elevation is \(53^\circ.\)

Subsection 4.2.5 Determining Angles of Elevation in Different Situations

Activity 4.2.6.

Work in groups
  • Each group chooses at least 2 tall objects to observe, such as: A flagpole, a clock on the wall, a school building corner, a distant tree e.t.c.
  • From a known distance (e.g. 5 m, 7 m, or 10 m) from the base of each object: measure the angle of elevation from your eye level to the top of the object. Record both the horizontal distance and angle.
  • Groups can choose a different viewing distance for the same object and compare how the angle changes.
  • Draw scaled right-angled triangles using your measurements. Base = distance from object, Height = unknown (can be estimated using trigonometry if desired) Angle = measured angle of elevation. Label your drawings with the correct scale and features.
  • Discuss with your fellow learners: How does the angle of elevation change as you move farther away from an object? Why is it useful to know this angle in construction, surveying, or aviation? What would happen if you measured from the top of a hill?
\(\textbf{ Key Takeaway }\)
The closer you move towards an object the bigger the angle of elevation. When you move farther away, the angle gets smaller. This concept helps surveyors or engineers estimate heights when they can’t climb structures.”

Example 4.2.5.

Amina, a grade 9 student from Makini School is standing 6 meters away from the base of the flagpost. She is viewing the top of the flagpost. Make a scale drawing of the given information using a scale of \(1\, cm = 1\, m.\) Determine the angle of elevation and the height of the flagpost given Amina’s eye-level is \(1.5 \, m\) from the ground.
Solution.
The sketch:
The scale drawing of the information given is:
The height of the flagpost is \(5.0 m + 1.5 m = 6.5 m.\)
The angle of elevation is \(40^\circ.\)

Subsection 4.2.6 Identifying Angles of Depression in Real Life Situations

Activity 4.2.7.

Work in groups
  • Identify Observation Points: Find raised platforms around your school β€” such as a staircase, or balcony β€” where you can safely observe the ground.
  • Observation and Measurement: From the elevated spot; Choose three different objects or points below (e.g., a stone, plant bed, frind’s shoes). Record the angle at which you tilt your head downward to each object. Record each measurement and the horizontal distance from the base of your observation point to the object.
  • Sketch simple side-view diagrams showing the horizontal line from their eye level and the line of sight downward. Label each angle using correct notation (e.g., 25Β°, 40Β°). Draw a scaled triangle showing horizontal distance, vertical height, and angle.
\(\textbf{ Key Takeaway }\)
β€œWhen do you find yourself looking downward toward something?” (e.g., looking down at a car from a balcony, watching students below, or spotting a ball on a field).
The angle at which you tilt your head downward to look towards an object is known as angle of depression \((\theta)\text{.}\)

Example 4.2.6.

Amani is staring at a garden bench from the window of his room, which is \(4\,m\) above the ground. The horzontal distance to the bench is \(6.9 \, m.\) Determine the angle of depression.
Solution.
First use the information to draw the sketch:
First, choose a suitable scale to display the given information. When you choose a scale of \(1\,cm = 1\,m,\) The scale drawing representation will be:
From a window 4 meters high, the angle of depression to a garden bench is 30Β°.

Subsection 4.2.7 Determining Angles of Depression in Different Situations

Activity 4.2.8.

Work in groups
  • Choose an elevated position around your school (like a stairwell or balcony).
  • Measure and record the vertical height from your eyes to the ground.
  • Identify objects on the ground (like a rock, a shoe, a plant e.t.c.).
  • Measure the horizontal distance from the object to the base of the platform. Groups can choose a different viewing distance for the same object and compare how the angle changes.
  • Draw scaled right-angled triangles using your measurements. Label your drawings with the correct scale and features. Measure the angle of depression using a protractor.
  • Share your results with other groups and discuss your findings. How does the angle of depression change as you move farther away from or closer to an object?
\(\textbf{ Key Takeaway }\)
Imagine you’re standing on a balcony looking at an object on the ground:
If the object is very close to the base of the building, your line of sight is steep, creating a larger angle of depression.
As the object moves farther away, your line of sight becomes shallower, resulting in a smaller angle of depression.

Example 4.2.7.

Mwema is standing on a \(24\)-meter-high observation deck and sees a bicycle on the ground \(50\) meters away from the base of the tower. What is the angle of depression to the bicycle?
Solution.
First, draw a sketch from the given information
The scale drawing of the above sketch using a scale of \(1\,cm = 10\,m\) is:
From the deck 24 meters high, the angle of depression to the bicycle is \(25.4^\circ.\)

Subsection 4.2.8 Applying Scale Drawing in Simple Surveying

Surveying is like giving the world a measured sketch so we can understand where things are and how far apart they are.
Surveying is the process of measuring land and spaces to figure out distances, angles, directions, and positions. It helps create maps, plan buildings, roads, bridges, and more.
A field notebook is a small, portable book used by surveyors and even studentsβ€” to record observations, measurements, sketches, and notes taken while working outside or β€œin the field.”
The methods used in surveying are:

Subsubsection 4.2.8.1 Using Bearing and Distance

Activity 4.2.9.
Work in groups
Materials Needed
Measuring tapes, graph paper or drawing sheets, rulers and protractors, clipboards and pencils.
  • Define the Survey Area: Choose a safe, open area like: a section of the schoolyard, the path between classrooms and the field, a rectangular garden or sports court.
  • Walk the perimeter and measure key dimensions (lengths of paths, distances between trees, classrooms, etc.) Record angles at corners.
  • Select a suitable scale (e.g., 1 cm = 2 meters or 1:200) depending on the area size and graph paper.
  • Draw the Scale Map: Translate measurements onto graph paper using your scale and label features (classrooms, field etc.) Use symbols and a key to show real-world features.
  • Discuss your findings with other learners. What did you find difficult in this activity?
\(\textbf{ Key Takeaway }\)
Plotting positions using bearings and distances on a scale map is similar to how surveyors map land features or plan navigation paths.
Example 4.2.8.
A team of surveyors is hired to map out the positions of hidden ’treasure markers’ on a field. You are given a starting location (the Base Station) and a list of distances and compass bearings to each marker. Use bearings and scaled distances to plot locations on a survey map and discover the hidden treasure!
\(\textbf{Bearing and Distance Data}\)
Target Point Bearing from A\((^\circ)\) Distance from A(m)
B \(045Β° \) \(50\)
C \(120Β°\) \(70\)
D \(200Β°\) \(60\)
E \(310Β°\) \(40\)
Solution.
Set up your map scale: You may choose a scale of \(1 \, cm = 10 \, meters.\)
Start by marking your Base Station (Point A) near the center of your page.
Use the Bearing and Distance Data Table above to draw the positions of other points (B, C, D, and E) from Point A.
Joining the points B, C, D, and E forms the boundary where the treasure is.
Using Bearing and Distance

Subsubsection 4.2.8.2 Using a Baseline

A baseline, in surveying, is a measured straight line between two fixed points on the ground. It serves as the reference line from which other points are located and measured.
Activity 4.2.10.
Work in groups
Materials Needed
Measuring tapes, graph paper or drawing sheets, rulers, clipboards and pencils, pegs or sticks to mark points on the field.
  • Set Up the Baseline:Choose a flat, open area like a playground. Measure and mark a baseline (e.g., 10 meters between Point A and Point B). This will be your reference line.
  • Identify Target features: From the base line AB, observe and mark other features (like a tree, a rock, classroom, flagpole e.t.c.) from your line of sight.
  • Connect the targeted feature (e.g tree) to the base line AB using a perpendicular line and record the measurements of the line. Do this for the remaining targeted features.
  • Make a scale drawing of your findings and share your findings with other learners.
\(\textbf{Key Takeaway}\)
The baseline is used to create scaled geometric representations of land.
The baseline is the backbone of many surveying techniques. It’s a precisely measured straight line on the ground that serves as a reference for locating other points using angles and distances.
Example 4.2.9.
The figure below represents a farm drawn to scale (\(1\, cm\) represents \(10 \, m\)). Develop a field book.
Solution.
Use a ruler to measure the lengths and convert them to actual scale.
Base line XY \(=10\,cm \) \(10 \times 10 \,m = 100 \,m \)
A to XY \(=1\,cm \) \(1 \times 10 \,m = 10 \,m \)
B to XY \(=1\,cm \) \(1 \times 10 \,m = 10 \,m \)
C to XY \(=4\,cm \) \(4 \times 10 \,m = 40 \,m \)
D to XY \(=2\,cm \) \(2 \times 10 \,m = 20 \,m \)
E to XY \(=3\,cm \) \(3 \times 10 \,m = 30 \,m \)
F to XY \(=2\,cm \) \(2 \times 10 \,m = 20 \,m \)
The information on a field book will be:
\(\textbf{Bearing and Distance Data}\)
Y
\(80\) \(20 \text{ To } F\)
To D \(20\) \(70\)
To C \(40\) \(50\)
\(30\) \(30\) To E
To B \(10\) \(20\)
To A \(10\) \(10\)
X

Subsection 4.2.9 Appreciating the Use of Scale Drawing in Real Life Situations

Appreciating scale drawing means understanding how it helps us plan, design, and communicate ideas clearly and accuratelyβ€”turning big ideas into manageable, measurable visuals.

Activity 4.2.11.

Create a scale drawing of a real or imagined space
  • Choose a space to design (e.g., your bedroom, classroom, or a dream room).
  • Measure or estimate the actual dimensions of the space and its furniture.
  • Select a scale for your drawing. Example: \(\text{1 cm on paper} = \text{0.5 meters in real life}\)
  • Draw the layout on the grid below. Include: Walls and boundaries, furniture or features (bed, desk, windows, etc.), labels for each item, a title, scale, and compass direction (N).
  • Discuss with your fellow learners: What scale did you choose and why? How did using a scale drawing help you plan your space? What challenges did you face while drawing to scale?
\(\textbf{Why does scale drawing matter in real life?}\)
  • Mathematics and Problem Solving: Scale drawings help us solve real-world problems involving area, perimeter, and proportions.
  • Maps and Navigation: Maps are scale drawings of land, helping us understand distances and directions.
What are other applications of scale drawing?